

Your application runs on the cloud. It depends on a managed database, an email sending API, a CDN, an authentication service… maybe a hosted AI model.
Each of these services displays an SLA (Service Level Agreement): a contractual availability commitment.
Your provider promises 99.9%. You sign. Everything’s fine.
Except that… 99.9% means 43 minutes of allowed downtime per month. Right during Black Friday, a Monday morning, or the client demo.
And in the contract? It’s written in black and white: that’s normal, no compensation.
An SLA is a bit like your car warranty:
- “Covered for 5 years” sounds great…
- …until you read the exclusions: normal wear and tear, misuse, OEM parts only
- And you have to send a registered letter within 15 days
This article is the guide to reading the fine print, with real numbers, real contracts, and tools to calculate for yourself.
SLA, SLO, SLI: let’s define the terms
Three acronyms, three different roles. They’re often confused, but it’s important to distinguish them before going further.
| Term | What it is | Example |
|---|---|---|
| SLI (Service Level Indicator) | The raw metric measured by your monitoring tools | ”HTTP 5xx error rate over the last 5 minutes” |
| SLO (Service Level Objective) | The internal target you set for yourself | ”Our success rate must stay above 99.95% over 30 days” |
| SLA (Service Level Agreement) | The contract with your client or provider, with financial consequences | ”99.9% monthly availability, or credits” |
In short: the SLI measures, the SLO sets the target, the SLA is legally binding.
In practice, your SLO should always be more ambitious than your SLA. If you promise 99.9% to your clients, aim for 99.95% internally. The gap between the two is your safety net.
The real cost of a “nine”
Availability is measured in “nines”: 99%, 99.9%, 99.99%…
Each additional nine divides downtime by 10. Simple, right?
Except that perception is deceiving. The difference between 99% and 99.9%? Over 6 hours less downtime per month. Between 99.9% and 99.99%? We go from 43 minutes to 4 minutes.
An e-commerce site generating EUR 100,000 revenue/day, concentrated over 6 peak hours. 43 minutes of downtime during that window = potentially EUR 10,000 in losses, not counting abandoned carts.
To better visualize the impact, here’s an interactive calculator. Move the slider to change the availability percentage and see the corresponding downtime per day, month, and year. It’s bidirectional: you can also directly modify a downtime value to find the associated percentage.
What's the impact on your availability?
Interactive tool, test with your own numbersOutages happen (really)
This isn’t theory. Here are some recent incidents:
-
AWS us-east-1, October 20, 2025: a race condition in DynamoDB’s DNS system erroneously deletes active DNS records1. Over 15 hours of downtime. Netflix, Slack, Snapchat, Coinbase, Expedia offline. 3,500+ companies impacted across 60+ countries, over 4 million reports in 2 hours.
-
Cloudflare, November 18, 2025: a bug in the Bot Management system generates an oversized configuration file, propagated across the entire network. Result: servers crash in cascade2. ~2 hours of global downtime. X, ChatGPT, Spotify, Anthropic, Canva, League of Legends unreachable.
-
Cloudflare, December 5, 2025: same story a month later. A modification to HTTP request parsing causes an outage affecting 28% of global traffic3 for 25 minutes.
-
Google Cloud, June 12, 2025: a null pointer bug takes down more than 50 services for 7 hours4. Spotify, Gmail, Fitbit affected.
-
OVHcloud Strasbourg, March 10, 2021: a fire destroys the SBG2 datacenter. 3.6 million websites offline, data permanently lost because backups were in the same building. OVH ordered to pay EUR 145,000 in damages5.
All these incidents were covered by SLAs. The credits refunded? A fraction of the monthly bill.
Between August 2024 and August 2025, AWS, Azure, and Google Cloud accumulated over 100 service outages6. It’s not the exception, it’s the norm.
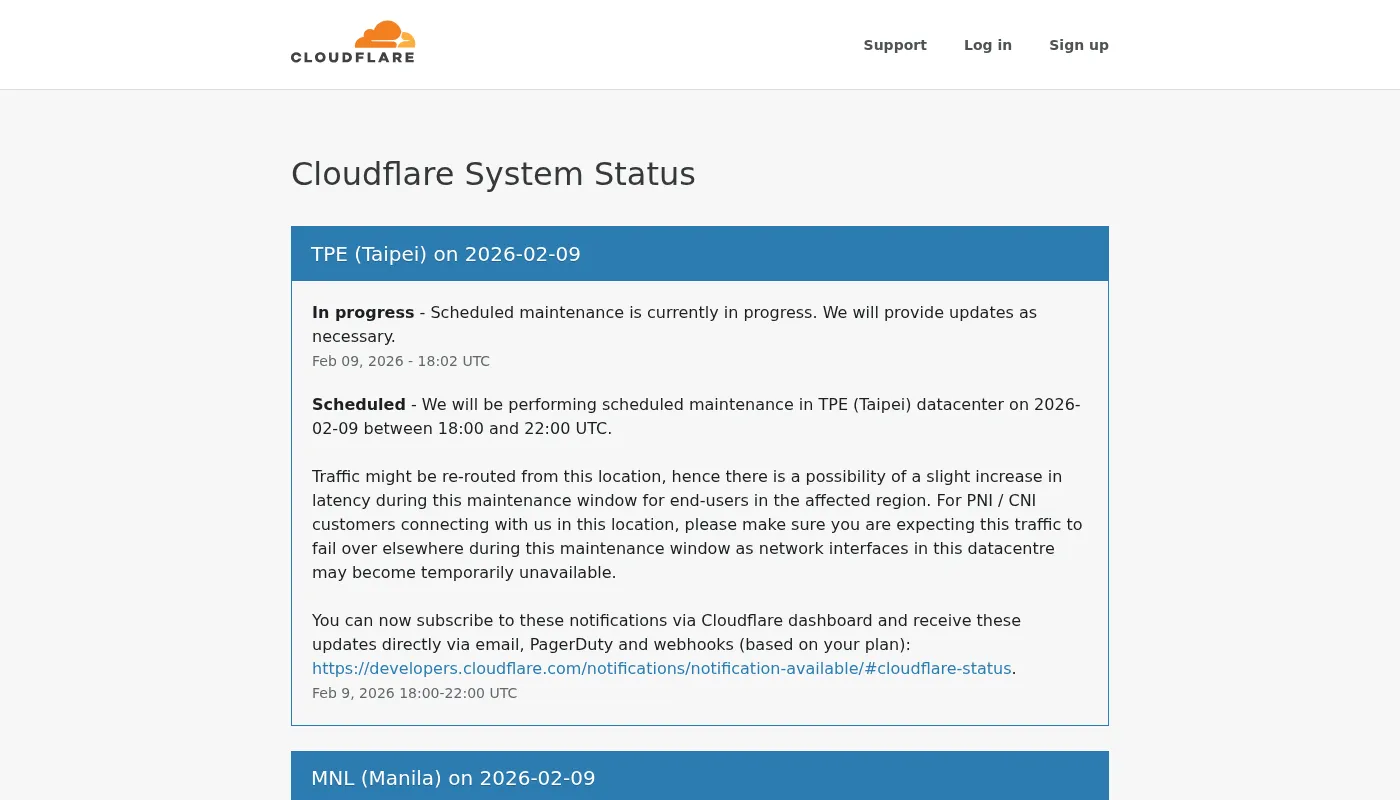
Status pages: your first reflex
How do you know if your provider is down right now?
That’s the role of the status page: a public page where the provider displays the state of its services in real time:
It’s also your source of evidence if you need to claim SLA credits.
The status page only reflects what the provider chooses to show. During the December 2021 AWS incident, the AWS health dashboard was itself unreachable.
What the SLA doesn’t tell you
The displayed percentage is appealing. But it hides the essentials.
The very restrictive definition of “outage”
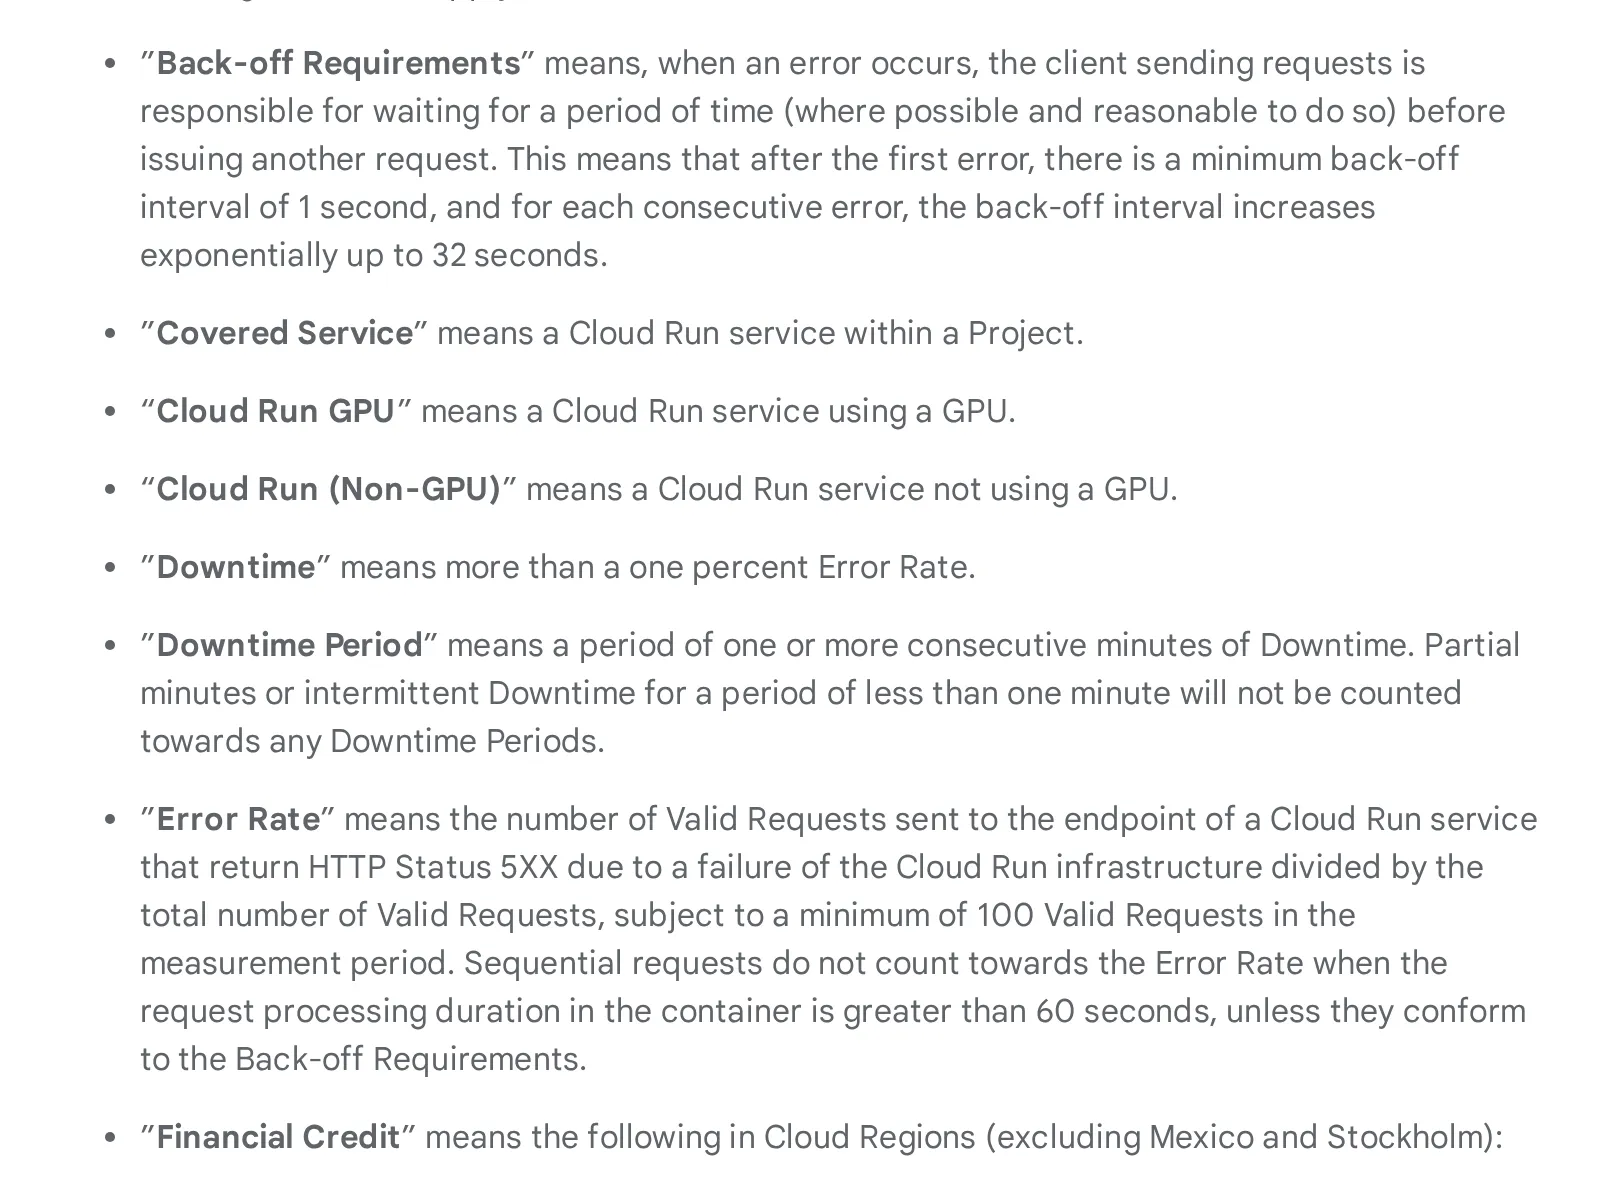
At Google Cloud (Cloud Run functions)7, unavailability is only counted if the error rate exceeds 10% of requests over a period of consecutive minutes.
In practice:
- An isolated timeout? Not counted.
- A 30-second latency spike? Not counted.
- An intermittent issue lasting less than a minute? Not counted.
Your user, however, saw a blank page.
The “error rate” itself is defined restrictively: it’s the ratio of failed requests to total attempts, with a minimum of 100 requests for the measurement to count.
Your Cloud Run function receives 80 requests in a minute, and 70 fail (87% errors). From the SLA’s perspective? It doesn’t count. You needed at least 100 requests for that minute to be evaluated. Result: the service is considered “100% available” during that period, while your users experienced 87% failures.
When the service “works”… but nothing actually works
Your API returns errors in bursts. Your users see blank pages. But on the provider’s side? Everything’s green. The service is “available.”
How is that possible?
Because there’s an entire category of errors that the provider doesn’t consider as unavailability. These are errors “caused by you,” even though in practice they’re often linked to platform limitations.
Throttling (rate limiting): this is the most common case under load. Every cloud service imposes quotas: a maximum number of requests per second, per minute, per account. When you exceed that quota, the service responds with 429 Too Many Requests. It doesn’t crash, it deliberately slows you down. It’s like a toll gate closing lanes during rush hour: the highway “works,” you just can’t access it anymore.
Your email sending API (Mailjet, SendGrid…) allows 100 calls/second. Your marketing campaign triggers 500 calls/second. Result: 80% of requests are rejected with 429. From the SLA perspective? Everything’s fine, the service “works.” From the user perspective? Order confirmation emails aren’t going out.
But throttling isn’t the only blind spot:
400 Bad Request: payload too large, malformed request, missing parameter. The provider considers it your code’s fault- Cold starts: on serverless functions (Lambda, Cloud Functions…), the first request after a period of inactivity can take several seconds while the environment boots up. It’s not an error in SLA terms, but for the user waiting, it’s lost time
- Degraded latency: the service responds, but in 5 seconds instead of 200ms. As long as it responds, it’s “available”
From the end user’s perspective, the result is the same: it doesn’t work.
If you’ve ever load tested your APIs, you may have hit these limits. See our article on realistic load testing.
Does a 100% SLA exist?
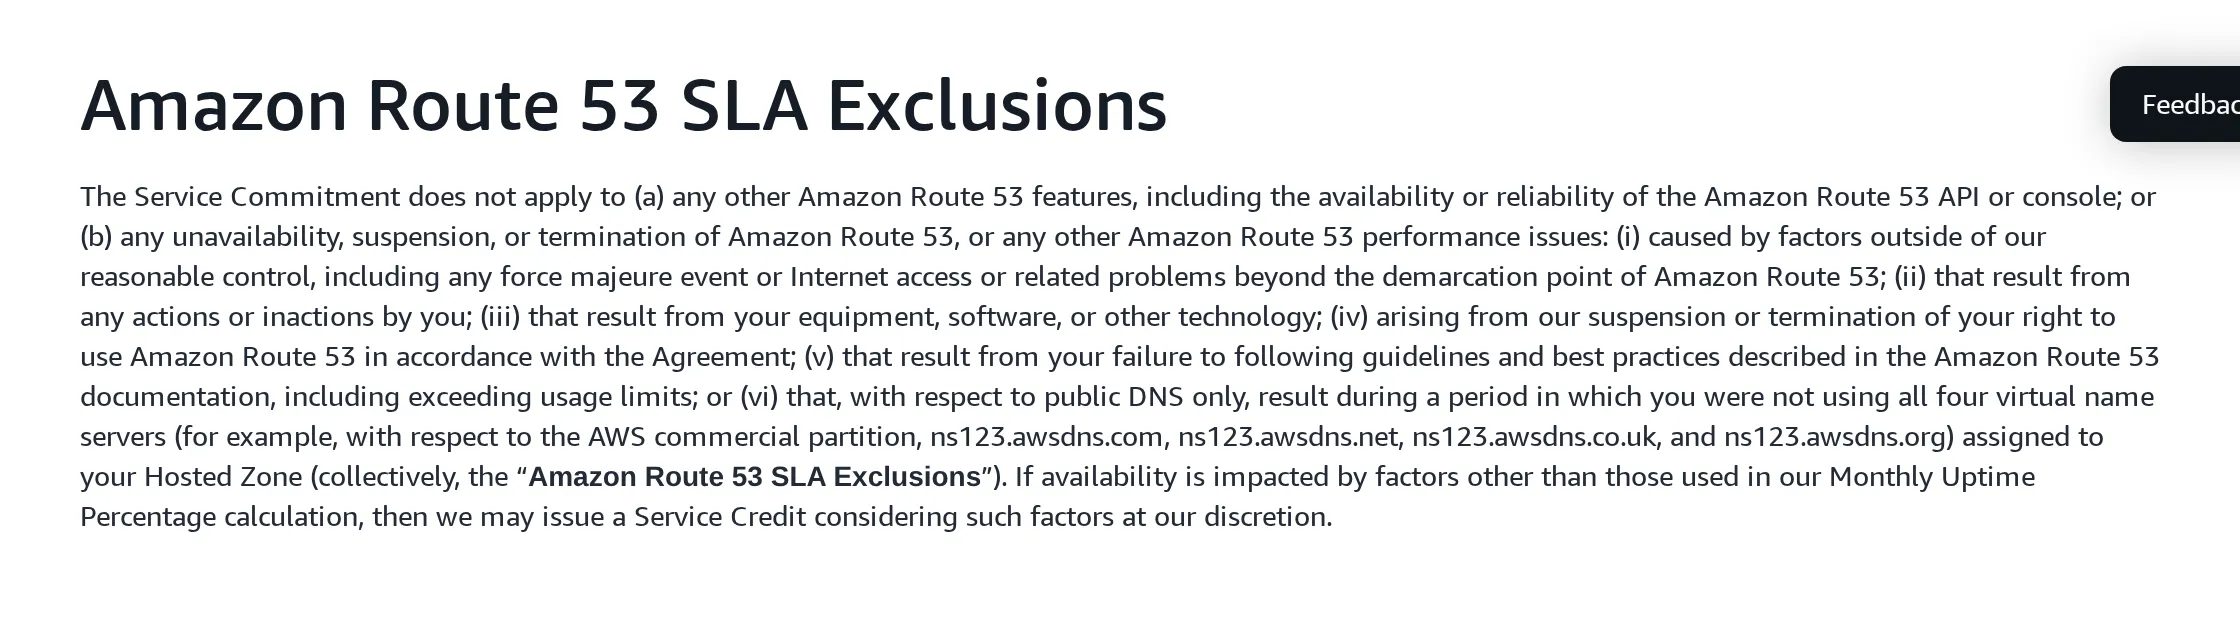
AWS Route 538 displays 100% availability.
Impressive… except it excludes:
- DNS propagation errors
- Misconfigurations
- Regional outages
Basically, the service is “available” as long as their servers respond, not necessarily that your domain works.
Scheduled maintenance doesn’t count
Even emergency maintenance. At Azure9, planned maintenance windows don’t count toward the availability calculation.
The SLA measures what the provider decides to measure, not what your users experience.
The composite SLA trap
This is the calculation nobody does. And it changes everything.
Your application never depends on a single service. It goes through an API Gateway, a database, a cache, a CDN, an email service…
And SLAs multiply:
System SLA = SLA₁ × SLA₂ × SLA₃ × …
Take a classic e-commerce architecture. Each service shows 99.9% availability:
- API Gateway + API Service + Database, 3 components in series: 0.999 × 0.999 × 0.999 = 99.7% → 2h 10min of allowed downtime/month (instead of 43 min for a single service)
- CDN + API Gateway + API Service + Database + Object Storage, 5 components: 0.999⁵ = 99.5% → 3h 36min of downtime/month
You thought you had 43 minutes of allowed downtime? With a standard architecture with 5 dependencies, it’s over 3 hours of cumulative downtime per month.
The good news: redundancy reverses the trend. Two replicas of a 99.9% database yield a 99.9999% SLA for that component.
The tradeoff:
- Each replica = an instance to pay for
- Synchronization to manage
- An extra load balancer in the chain (with its own SLA…)
To see it for yourself, here’s a composite SLA simulator. Add the services from your actual architecture (API Gateway, database, cache, email…) and watch the overall SLA drop. You can toggle a service into HA (high availability) mode to simulate adding a replica and see how redundancy improves the result.
What's the SLA for your architecture?
Interactive tool, configure your architectureIf you’re committing to an SLA with your own customers, this calculation is your starting point. Always promise less than your actual composite SLA. That’s your buffer when a provider has an incident.
Compensations: the devil in the details
If the SLA isn’t met, you get a refund?
In theory, yes. In practice, it’s more nuanced.
| Provider | SLA | Credits | Conditions |
|---|---|---|---|
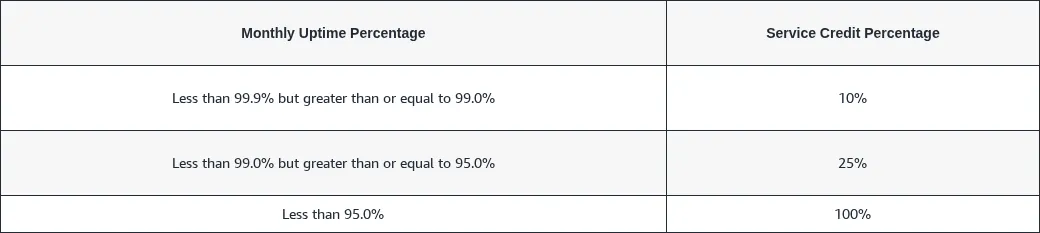
| AWS S3 | 99.9% | 10% → 25% → 100% | Via AWS Support |
| Azure Blob Storage | 99.9% | 10% → 25% | Throttling excluded |
| Google Cloud Run | 99.95% | 10% → 25% → 50% | Max 50%, within 30 days |
| Clever Cloud | 99.9% | Formula: unavailability% × annual bill × 2 | Annual, max 10% of R |
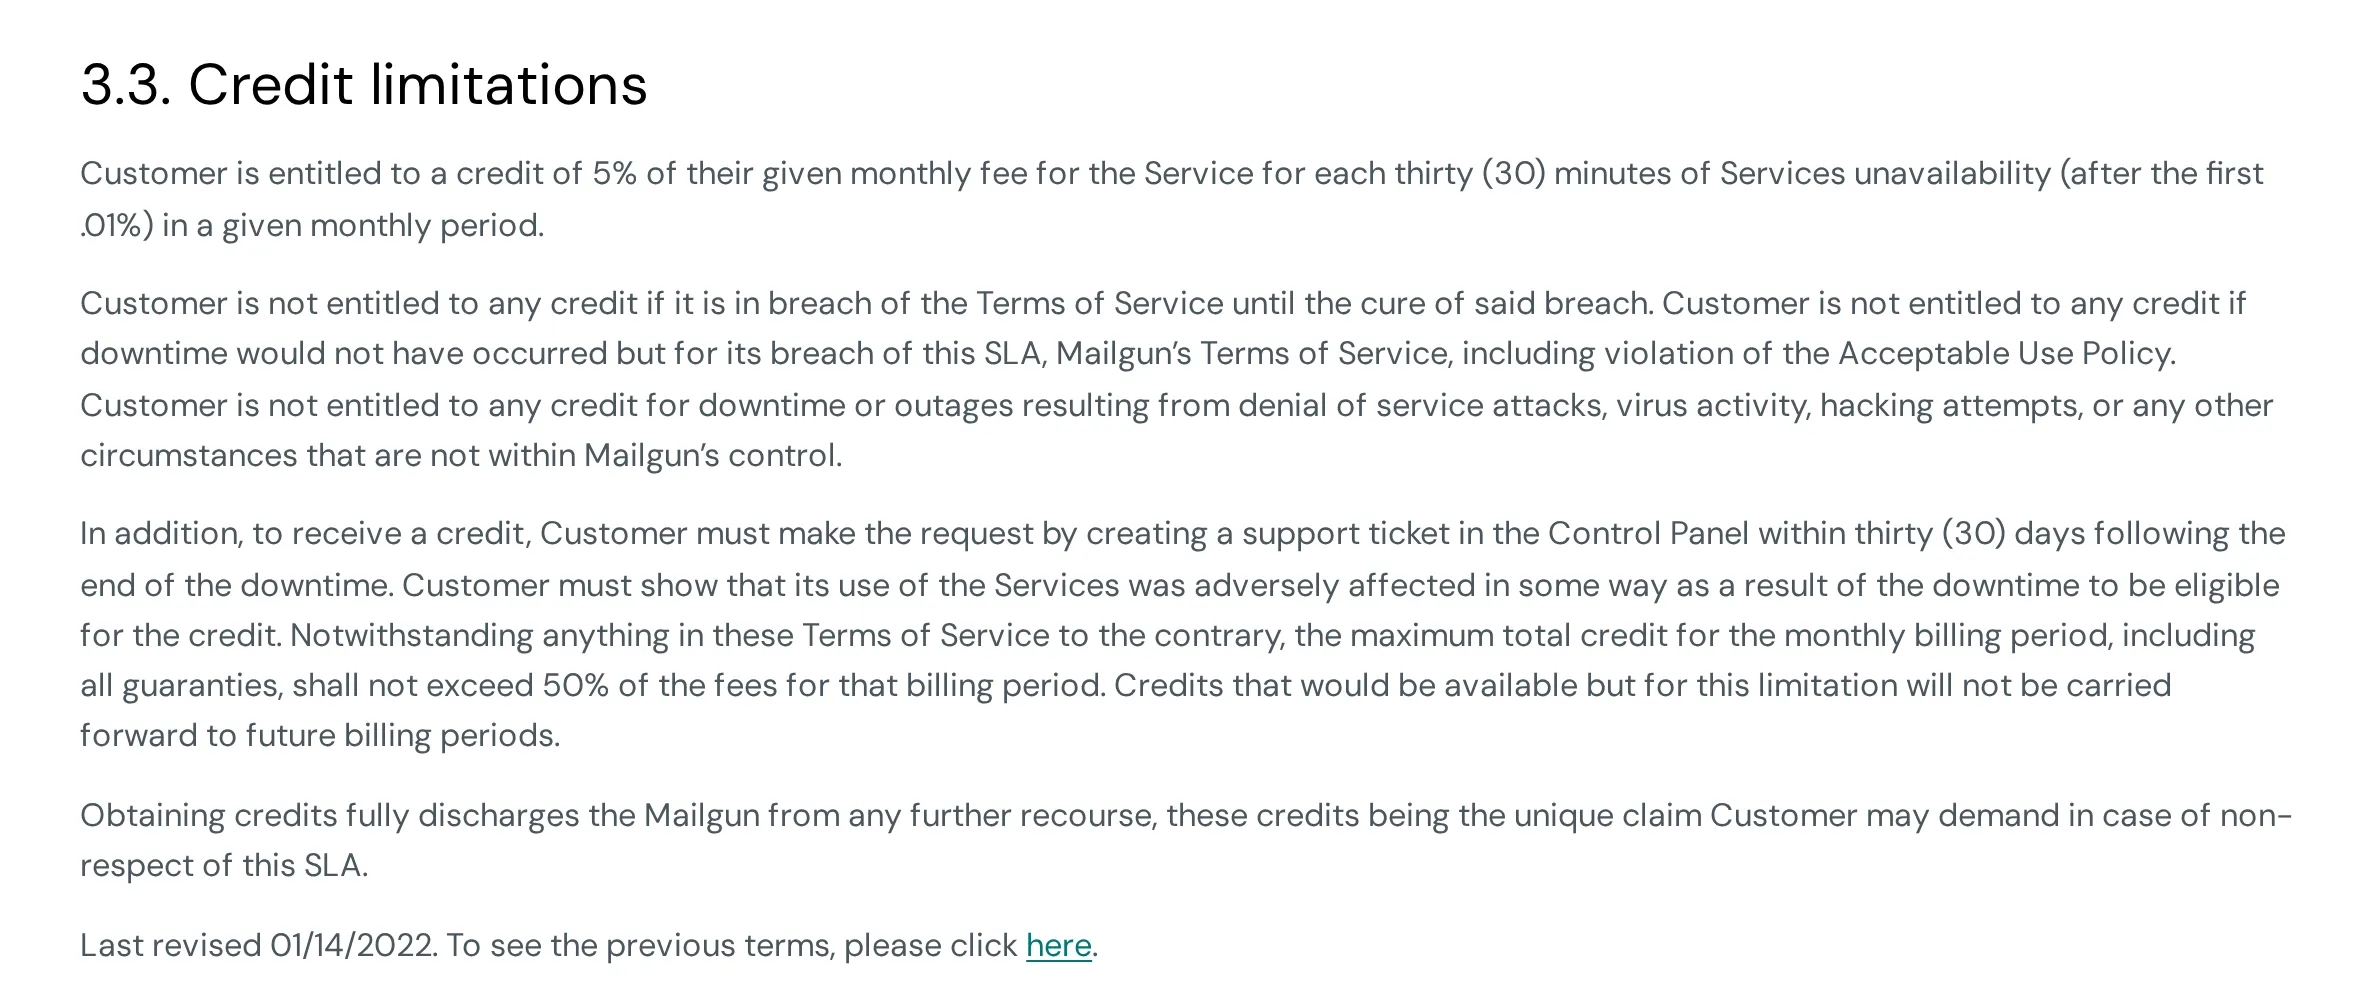
| Mailjet API | 99.99% | 5% per 30-min increment | Within 30 days, max 50% |
The Clever Cloud formula deserves an explanation: T is the unavailability rate (minutes of downtime ÷ minutes in the month), R is the annual fee (monthly bill × 12). So, for 9 hours of downtime in a month with EUR 500/month consumption: T = 540 / 43,200 ≈ 1.25%, R = EUR 6,000, penalty = 1.25% × 6,000 × 2 = EUR 150, capped at 10% of R, i.e. EUR 600.
The common thread? You have to claim it yourself. No one will refund you spontaneously:
- At AWS, you need to open a Support ticket
- At Clever Cloud, provide a ticket with proof of unavailability within 60 days
- At Mailjet, claim within 30 days with proof of impact
- No claim = no credit
And the amounts are capped: often 50% or 100% of the monthly bill, not your actual losses.
The price of a better SLA
SLA credits exist, but you still need to be able to claim them. Each provider offers a tiered support plan, from free to premium, with prices that vary considerably.
At the hyperscalers, these plans don’t change the SLA percentage: they improve the support (response time, dedicated contact) and therefore your ability to claim credits.
| Provider | Plan | Cost | Response (critical case) |
|---|---|---|---|
| AWS | Basic | Free | Self-service only |
| Business+ | From $29/mo (3–9% of bill) | < 30 min | |
| Enterprise | From $5,000/mo (3–10% of bill) | < 15 min, dedicated TAM | |
| Azure | Basic | Free | Self-service only |
| Developer | $29/mo | Business hours | |
| Standard | $100/mo | < 1h, 24/7 | |
| Pro Direct | $1,000/mo | < 1h, dedicated escalation | |
| Google Cloud | Basic | Free | Self-service only |
| Standard | $29/mo (or 3% of bill) | 4h, 5 days/week | |
| Enhanced | From $100/mo (or 10% of bill) | < 1h, 24/7 | |
| Premium | From $15,000/mo (or 10% of bill) | < 15 min, dedicated TAM | |
| Clever Cloud | Standard | Included | Ticket, business hours |
| Premium | 1.8× usage + EUR 490/mo excl. tax | ≤ 15 min, 24/7 |
No paid plan, no technical support. With the Basic (free) plan from AWS, Azure, or Google Cloud, you only get self-service and billing support. To open a technical ticket (required to claim an SLA credit), you need at least a paid plan (from ~$29/month).
Watch out for “response time.” The durations shown in the table (15 min, 1h…) correspond to the initial response time, meaning the first acknowledgment of your ticket, not the resolution of the problem. Between “we’ve received your request” and the actual fix, hours or even days can pass. No provider contractually commits to a resolution timeframe.
Monthly or annual: the measurement period changes everything
The majority of hyperscalers (AWS, Azure, Google Cloud) measure availability monthly. Consequence: a massive outage on the 30th? The counter resets to zero on the 1st. The incident is “forgotten.”
Clever Cloud is the exception with an annual SLA (99.9% standard, 99.99% on the Premium plan). The Premium plan also changes the penalty formula (50× more favorable) and raises the cap to 1 month of consumption, vs. 10% of the annual fee on standard. The difference in measurement period is significant:
- Monthly SLA (AWS, Azure, GCP): each month is evaluated independently. 6 small outages spread over 6 months? Each month can stay above the threshold → no credit, even if the cumulative total is significant
- Annual SLA (Clever Cloud): downtime accumulates over 12 months. The same 6 outages end up blowing the annual budget → a credit is triggered
The refund simulator at the bottom of this article compares both models. Test with frequent but short outages: you’ll see that only Clever Cloud’s annual SLA triggers a credit.
AWS S3 displays a durability of 99.999999999% (11 nines). That’s the probability of not losing your data, not the availability to access it. Two very different metrics.
First time dealing with this topic? The key takeaway from this section: never count on SLA credits to cover your actual losses. Factor this risk into your budget and architecture, not into your refund hopes.
Error budget: steering instead of suffering
The concept comes from the Google SRE Book10 and changes how reliability is managed.
Until now, the SLO is a passive number: “we aim for 99.95%.” The error budget makes it actionable. The principle: if your SLO is 99.95%, you accept 0.05% of unavailability. That 0.05% is your budget. Over a 30-day month, that’s ~22 minutes.
Every incident, every failed deployment, every degraded latency consumes this budget. When there’s budget left, you have room to innovate. When it runs out, that’s the signal to consolidate.
The math
The formula is straightforward:
Error budget = (1 - SLO) x measurement period
| SLO | Budget / month | Budget / quarter |
|---|---|---|
| 99.9% | 43 min | 2h 10min |
| 99.95% | 22 min | 1h 05min |
| 99.99% | 4 min 19s | 13 min |
The more ambitious your SLO, the tighter your budget. This is a conscious tradeoff: a 99.99% SLO leaves you less than 5 minutes of margin per month. Every deployment becomes a calculated risk.
The decision circuit
The real value of the error budget is that it turns an abstract number into a concrete decision rule for teams:
- Comfortable budget (> 50% remaining): ship, experiment, take calculated risks
- Tight budget (< 30% remaining): freeze non-critical deployments, focus on stability
- Exhausted budget: mandatory post-mortem, total deployment freeze, action plan before resuming
Your SLO is 99.95%, giving you 22 minutes of budget this month. On Monday, a network incident eats 8 minutes. On Wednesday, a failed deployment adds 10 more. You have 4 minutes of margin left. The cart redesign is ready, but deploying it now risks draining the budget. Decision: wait until next month.
Without an error budget, this decision would be an opinion battle between the PM who wants to ship and the ops engineer who wants stability. With the budget, it’s a fact: 4 minutes left, don’t take the risk.
How to manage it day-to-day
The error budget isn’t tracked in a spreadsheet. SRE teams rely on monitoring tools that calculate the burn rate (how fast the budget is being consumed) in real time:
- Datadog SLO Tracking: SLO definitions with automatic burn rate alerts
- Prometheus + Grafana: open source stack, ideal for getting started without a tooling budget
- Honeycomb Burn Alerts: predictive alerts that warn before the budget runs out
The burn rate answers a simple question: “at this pace, when will the budget run out?” If the answer is “in 3 days” and you’re only on the 10th of the month, there’s a structural problem to address, not just an incident to resolve.
If you don’t have tooling yet, start with Prometheus + Grafana: it’s free and covers 80% of needs. What matters isn’t the tool, it’s making the budget visible to the entire team.
Ultimately, the error budget transforms the SLO from a passive number into a daily decision-making tool that aligns product and ops teams on a shared fact, not a gut feeling.
Committing to an SLA for your customers
If you’re the one who needs to commit, flip the problem:
- List your critical chain: all the services your product depends on
- Calculate your composite SLA: multiply the SLAs of each component
- Keep a margin: your chain gives 99.7%? Commit to 99.5%. You’ll need that margin for incidents not covered by provider SLAs
- Define your exclusions: scheduled maintenance, force majeure, misuse. These are the same levers your providers use
The SLA you promise can never be better than your weakest link, unless you invest in redundancy to strengthen it.
Simulate it yourself: how much will you get refunded?
Now that you know the exclusions, calculation formulas, and composite SLA pitfalls, test with your own numbers. Adjust the outage duration and your cloud bill to see how much each provider would refund, and compare with your actual losses.
How much does your SLA refund?
Interactive tool, simulate your refunds| AWS | Azure | Google Cloud | Clever Cloud | |
|---|---|---|---|---|
| Server errors (5xx)? | ||||
| Total unavailability? | ||||
| Degraded latency (slowdowns)? | ||||
| Throttling / rate limiting (429)? | ||||
| Cold starts? | ||||
| Scheduled maintenance? | ||||
| Multi-AZ / multi-zone required? | ||||
| Free / shared tier? | ||||
| Internet network (third-party)? | ||||
| Client maintenance? |
TL;DR
An SLA is neither comprehensive insurance nor a marketing claim to take at face value. It’s a minimum commitment, bounded by conditions nobody reads.
Key takeaways:
- SLI measures, SLO sets the target, SLA is legally binding
- 99.9% = 43 min of downtime/month, and it happens (see AWS, OVH, Cloudflare)
- The SLA doesn’t cover everything: throttling, cold starts, latency, scheduled maintenance
- SLAs multiply together: 5 services at 99.9% = 99.5% actual
- Compensations must be claimed, are capped, and don’t cover your losses
- Error budget turns the SLO into a daily decision-making tool
- Monitor the status pages of your providers
SLAs only bind those who listen to them.
What’s next?
Depending on where you stand:
- Don’t have SLOs yet? Start by instrumenting your SLIs: error rate, P95 latency, availability. Without measurement, no target.
- Have SLOs but no composite SLA? List your dependencies, multiply the SLAs, and compare with what you’re promising your customers. The calculator above is there for that.
- Committing to customer SLAs? Set up an error budget and a deployment freeze policy. That’s what turns a number on a contract into a daily steering tool.
Composite SLA, error budget, internal SLOs: we help tech teams set the right numbers and manage them day to day. Let’s talk.
Footnotes
-
AWS Outage Analysis, October 20, 2025 - ThousandEyes ↩
-
Cloudflare incident on November 18, 2025 - Cloudflare Blog ↩
-
Cloudflare incident on December 5, 2025 - Cloudflare Blog ↩
-
Google Cloud outage disrupts over 50 services globally for over 7 hours - NetworkWorld ↩
-
Incendie SBG2 Strasbourg : OVH condamné à verser plus de 100 000 EUR - Le Monde Informatique ↩
-
Major cloud outages 2024-2025 - IncidentHub ↩
-
Google Cloud Run functions SLA - Google Cloud ↩
-
Amazon Route 53 SLA - AWS ↩
-
Azure SLA for Online Services - Microsoft ↩
-
Service Level Objectives - Google SRE Book ↩